
Croydon recorded more thefts of a motor vehicle than any other London borough or Home Counties council area in the year to June 2026: 1,713, just ahead of Enfield (1,697) and Newham (1,665). Enfield had the highest rate, at 5.2 thefts for every 1,000 residents, with Thurrock in Essex close behind at 5.1. The biggest rise was in Wokingham, where thefts went up 37.5%, from 128 to 176.
This page ranks every London borough and every council area in Surrey, Kent, Essex, Hertfordshire, Berkshire, Buckinghamshire and Oxfordshire: 96 areas, 92 of them with figures. The numbers are thefts of a motor vehicle recorded by the police between July 2025 and June 2026, compared with the 12 months before, from the Home Office’s official crime data. For the national picture and the most stolen models, see our UK car theft statistics.
Key findings
Croydon had the most thefts of a motor vehicle (1,713), followed by Enfield (1,697), Newham (1,665), Barnet (1,524) and Bromley (1,404). The top three are less than 3% apart.
Enfield had the highest rate: 5.2 thefts per 1,000 residents. Thurrock in Essex was second (5.1), the highest outside London and well above Croydon (4.2).
The 16 areas with the most thefts are all London boroughs. Outside London, Thurrock had the most (920), then Milton Keynes (610) and Basildon (505).
Biggest rises (areas with at least 100 thefts the year before): Wokingham +37.5%, Colchester +33.4%, Tendring +33.1% and Reigate and Banstead +30.9%. In numbers, Croydon rose the most: 168 more thefts than the year before.
Car theft fell in 62 of the 92 areas. The biggest fall was in Basildon (−37.0%, from 801 to 505).
Across London’s boroughs and the City, thefts assigned to an area fell 6.0%, from 30,956 to 29,086.
The lowest rates were in South Oxfordshire (0.5 per 1,000), Vale of White Horse (0.6) and Waverley (0.6).
Thefts from vehicles (things taken from inside a car) are counted separately. Ealing had the most (2,609), then Newham (2,274) and Westminster (1,979).
Car theft by London borough
Thefts of a motor vehicle in all 32 London boroughs and the City of London, July 2025 to June 2026, sorted by number of thefts. Croydon had the most; Enfield had the highest rate, and Kingston upon Thames the lowest (1.8 per 1,000).
| Rank | Borough | Thefts, Jul 2025–Jun 2026 | Change on year before | Per 1,000 people |
|---|---|---|---|---|
| 1 | Croydon | 1,713 | +10.9% | 4.2 |
| 2 | Enfield | 1,697 | −2.3% | 5.2 |
| 3 | Newham | 1,665 | +8.3% | 4.4 |
| 4 | Barnet | 1,524 | −2.6% | 3.8 |
| 5 | Bromley | 1,404 | +4.5% | 4.2 |
| 6 | Redbridge | 1,145 | −13.6% | 3.6 |
| 7 | Hillingdon | 1,112 | +6.3% | 3.4 |
| 8 | Brent | 1,098 | −9.8% | 3.1 |
| 9 | Lewisham | 1,065 | −9.7% | 3.5 |
| 10 | Ealing | 1,059 | −2.5% | 2.7 |
| 11 | Barking and Dagenham | 1,037 | −2.4% | 4.5 |
| 12 | Waltham Forest | 998 | −20.5% | 3.6 |
| 13 | Greenwich | 981 | −13.6% | 3.3 |
| 14 | Haringey | 980 | −14.6% | 3.7 |
| 15 | Havering | 968 | −8.2% | 3.5 |
| 16 | Tower Hamlets | 930 | −3.8% | 2.8 |
| 17 | Southwark | 909 | −3.6% | 2.9 |
| 18 | Lambeth | 890 | −0.4% | 2.8 |
| 19 | Hounslow | 815 | −4.2% | 2.7 |
| 20 | Wandsworth | 809 | −10.2% | 2.4 |
| 21 | Harrow | 746 | +14.8% | 2.8 |
| 22 | Bexley | 732 | −26.0% | 2.9 |
| 23 | Hackney | 579 | −12.1% | 2.2 |
| 24 | Westminster | 577 | +1.8% | 2.7 |
| 25 | Merton | 562 | −12.9% | 2.6 |
| 26 | Richmond upon Thames | 483 | −15.1% | 2.5 |
| 27 | Camden | 479 | −19.4% | 2.2 |
| 28 | Hammersmith and Fulham | 469 | −18.6% | 2.5 |
| 29 | Kensington and Chelsea | 462 | +1.5% | 3.2 |
| 30 | Sutton | 450 | −12.8% | 2.1 |
| 31 | Islington | 416 | −23.4% | 1.9 |
| 32 | Kingston upon Thames | 315 | −17.1% | 1.8 |
| 33 | City of London | 17 | n/a | n/a |
The Metropolitan Police could not assign 1,823 thefts to a borough, so the borough figures add up to slightly less than the Met’s total. The ONS does not publish a rate for the City of London because so few people live there, and its change is not shown because the numbers are small.
The Met’s own borough data, which runs three months later (October 2025 to September 2026), puts Enfield first with 1,839, ahead of Newham (1,775) and Croydon (1,682). The top three swap places depending on which 12 months you look at.
Car theft in Surrey by district
In Surrey, Reigate and Banstead had the most thefts of a motor vehicle (237); Tandridge had the highest rate (2.0 per 1,000 residents). Across the 11 areas, thefts fell 7.7%, from 1,633 to 1,508.
| Rank | District | Thefts, Jul 2025–Jun 2026 | Change on year before | Per 1,000 people |
|---|---|---|---|---|
| 1 | Reigate and Banstead | 237 | +30.9% | 1.5 |
| 2 | Elmbridge | 185 | −16.7% | 1.3 |
| 3 | Tandridge | 180 | +11.8% | 2.0 |
| 4 | Spelthorne | 168 | −25.0% | 1.6 |
| 5 | Epsom and Ewell | 158 | −16.0% | 1.9 |
| 6 | Guildford | 124 | −17.3% | 0.8 |
| 7 | Runnymede | 123 | −8.9% | 1.3 |
| 8 | Surrey Heath | 90 | +20.0% | 1.0 |
| 9 | Woking | 88 | −34.8% | 0.8 |
| 10 | Mole Valley | 79 | −3.7% | 0.9 |
| 11 | Waverley | 76 | −5.0% | 0.6 |
Car theft in Kent by district
Four of Kent’s 12 areas have no district figures (see the note below the table). Of the rest, Dartford and Gravesham had the most thefts of a motor vehicle (339); Sevenoaks had the highest rate (1.9 per 1,000 residents).
| Rank | District | Thefts, Jul 2025–Jun 2026 | Change on year before | Per 1,000 people |
|---|---|---|---|---|
| 1 | Dartford and Gravesham | 339 | −22.6% | 1.4 |
| 2 | Swale | 290 | +6.6% | 1.8 |
| 3 | Sevenoaks | 231 | −6.1% | 1.9 |
| 4 | Canterbury | 194 | −11.0% | 1.2 |
| 5 | Thanet | 165 | +13.0% | 1.2 |
| 6 | Folkestone and Hythe | 119 | +43.4% | 1.1 |
| 7 | Dover | 116 | +0.9% | 1.0 |
| 8 | Ashford | 114 | −22.4% | 0.8 |
| Maidstone | Not available | Not available | Not available | |
| Medway | Not available | Not available | Not available | |
| Tonbridge and Malling | Not available | Not available | Not available | |
| Tunbridge Wells | Not available | Not available | Not available |
Because of IT problems at Kent Police, thefts in Maidstone, Medway, Tonbridge and Malling and Tunbridge Wells are not assigned to a district in the official data; the Home Office says Dartford and Gravesham are affected too, so treat that row with caution. Kent Police recorded 1,465 thefts it could not assign to a district, on top of the 1,568 shown above. We have left the missing areas blank rather than estimate them.
Car theft in Essex by district
In Essex, Thurrock had the most thefts of a motor vehicle (920) and the highest rate (5.1 per 1,000 residents). Across the 14 areas, thefts fell 10.5%, from 5,153 to 4,612.
| Rank | District | Thefts, Jul 2025–Jun 2026 | Change on year before | Per 1,000 people |
|---|---|---|---|---|
| 1 | Thurrock | 920 | −3.7% | 5.1 |
| 2 | Basildon | 505 | −37.0% | 2.6 |
| 3 | Epping Forest | 472 | −11.9% | 3.4 |
| 4 | Colchester | 403 | +33.4% | 2.0 |
| 5 | Southend-on-Sea | 384 | −22.1% | 2.1 |
| 6 | Tendring | 338 | +33.1% | 2.2 |
| 7 | Brentwood | 322 | +9.9% | 4.1 |
| 8 | Harlow | 295 | −14.2% | 3.0 |
| 9 | Chelmsford | 288 | −28.9% | 1.5 |
| 10 | Braintree | 175 | −17.5% | 1.1 |
| 11 | Uttlesford | 167 | −1.8% | 1.8 |
| 12 | Rochford | 139 | +8.6% | 1.5 |
| 13 | Castle Point | 134 | −26.4% | 1.5 |
| 14 | Maldon | 70 | −10.3% | 1.0 |
Car theft in Hertfordshire by district
In Hertfordshire, Broxbourne had the most thefts of a motor vehicle (306) and the highest rate (3.0 per 1,000 residents). Across the 10 areas, thefts fell 13.1%, from 2,302 to 2,001.
| Rank | District | Thefts, Jul 2025–Jun 2026 | Change on year before | Per 1,000 people |
|---|---|---|---|---|
| 1 | Broxbourne | 306 | −2.9% | 3.0 |
| 2 | St Albans | 278 | +5.3% | 1.8 |
| 3 | Hertsmere | 253 | −23.6% | 2.3 |
| 4 | Watford | 214 | −0.9% | 2.0 |
| 5 | East Hertfordshire | 213 | −17.4% | 1.4 |
| 6 | Dacorum | 203 | −31.9% | 1.3 |
| 7 | Welwyn Hatfield | 185 | −31.2% | 1.5 |
| 8 | Three Rivers | 159 | +4.6% | 1.7 |
| 9 | North Hertfordshire | 117 | −8.6% | 0.9 |
| 10 | Stevenage | 73 | +2.8% | 0.8 |
Car theft in Berkshire by council area
Berkshire is policed by Thames Valley Police. Slough had the most thefts of a motor vehicle (354) and the highest rate (2.1 per 1,000 residents). Across the 6 areas, thefts rose 1.4%, from 1,238 to 1,255.
| Rank | Council area | Thefts, Jul 2025–Jun 2026 | Change on year before | Per 1,000 people |
|---|---|---|---|---|
| 1 | Slough | 354 | +3.8% | 2.1 |
| 2 | Reading | 286 | −11.2% | 1.6 |
| 3 | Wokingham | 176 | +37.5% | 0.9 |
| 4 | Windsor and Maidenhead | 172 | −5.0% | 1.1 |
| 5 | Bracknell Forest | 134 | +8.9% | 1.0 |
| 6 | West Berkshire | 133 | −7.0% | 0.8 |
Car theft in Buckinghamshire by council area
Buckinghamshire is policed by Thames Valley Police. Milton Keynes had the most thefts of a motor vehicle (610); South Bucks had the highest rate (2.3 per 1,000 residents). Across the 5 areas, thefts rose 1.6%, from 1,389 to 1,411.
| Rank | Council area | Thefts, Jul 2025–Jun 2026 | Change on year before | Per 1,000 people |
|---|---|---|---|---|
| 1 | Milton Keynes | 610 | −6.3% | 2.0 |
| 2 | Wycombe | 277 | +6.1% | 1.5 |
| 3 | Aylesbury Vale | 245 | +17.8% | 1.1 |
| 4 | South Bucks | 174 | +12.3% | 2.3 |
| 5 | Chiltern | 105 | −7.9% | 1.1 |
Aylesbury Vale, Chiltern, South Bucks and Wycombe are the old district areas that now make up Buckinghamshire Council; the police still report crime for each one. Milton Keynes is a separate council.
Car theft in Oxfordshire by district
Oxfordshire is policed by Thames Valley Police. Oxford had the most thefts of a motor vehicle (188) and the highest rate (1.1 per 1,000 residents). Across the 5 areas, thefts rose 9.6%, from 539 to 591.
| Rank | District | Thefts, Jul 2025–Jun 2026 | Change on year before | Per 1,000 people |
|---|---|---|---|---|
| 1 | Oxford | 188 | +22.1% | 1.1 |
| 2 | Cherwell | 148 | −5.7% | 0.9 |
| 3 | Vale of White Horse | 92 | +33.3% | 0.6 |
| 4 | West Oxfordshire | 82 | +17.1% | 0.7 |
| 5 | South Oxfordshire | 81 | −9.0% | 0.5 |
What this means if you park on a driveway
Police figures don’t say whether a car was taken from a drive or the street, but they do show where the risk is highest. Suburban boroughs such as Croydon, Enfield, Barnet and Bromley top the London list, while central boroughs record far fewer: Camden had 479 and Islington 416. Thieves with relay devices can open and start a keyless car quickly and quietly, so the car on your drive is the one to protect. We explain how that works, and the simple steps that stop it, in our guide to preventing keyless car theft.
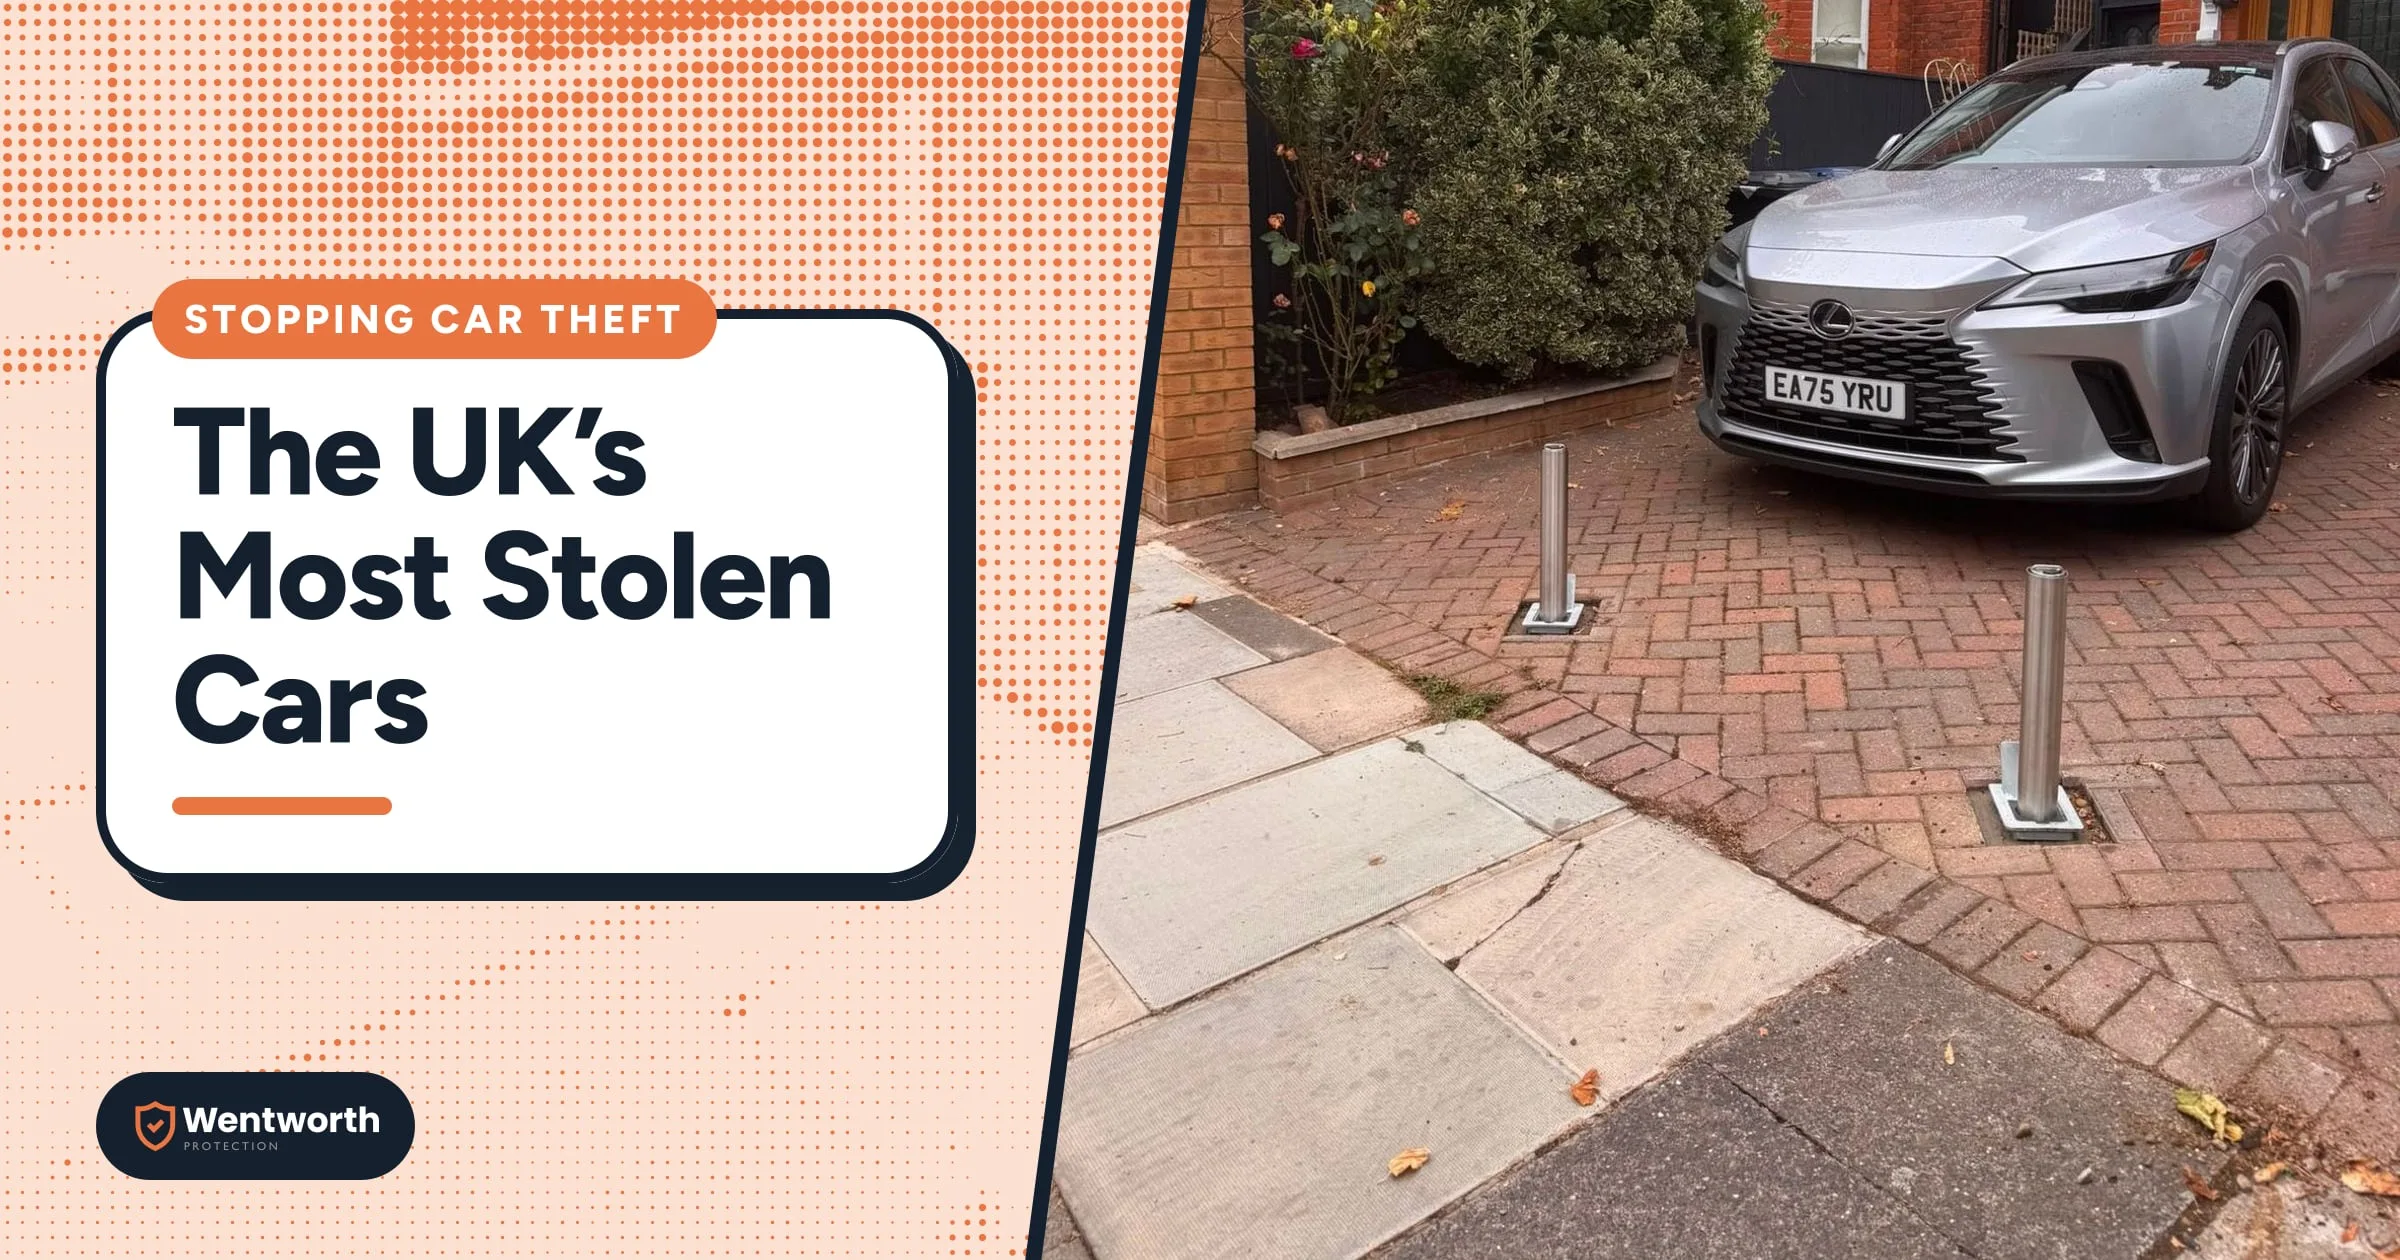
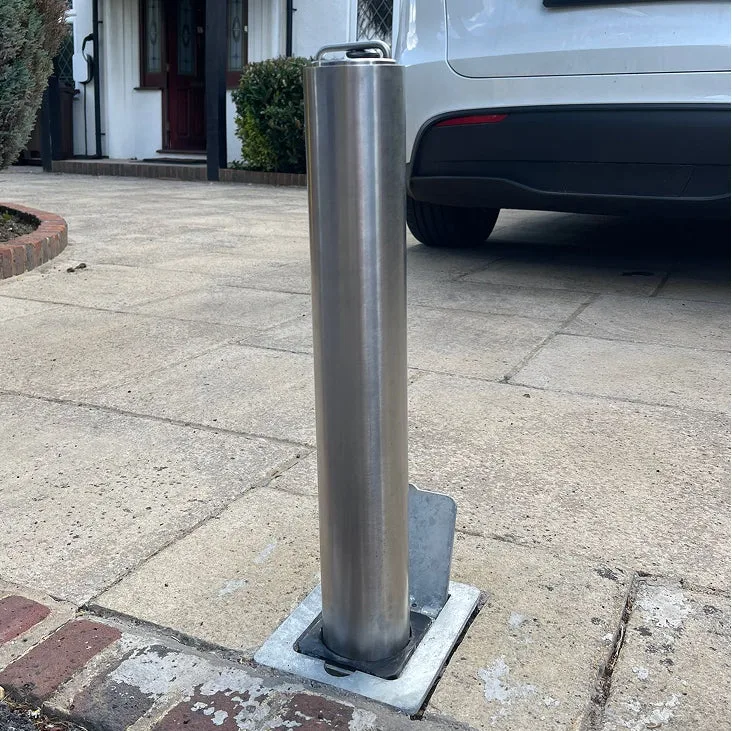
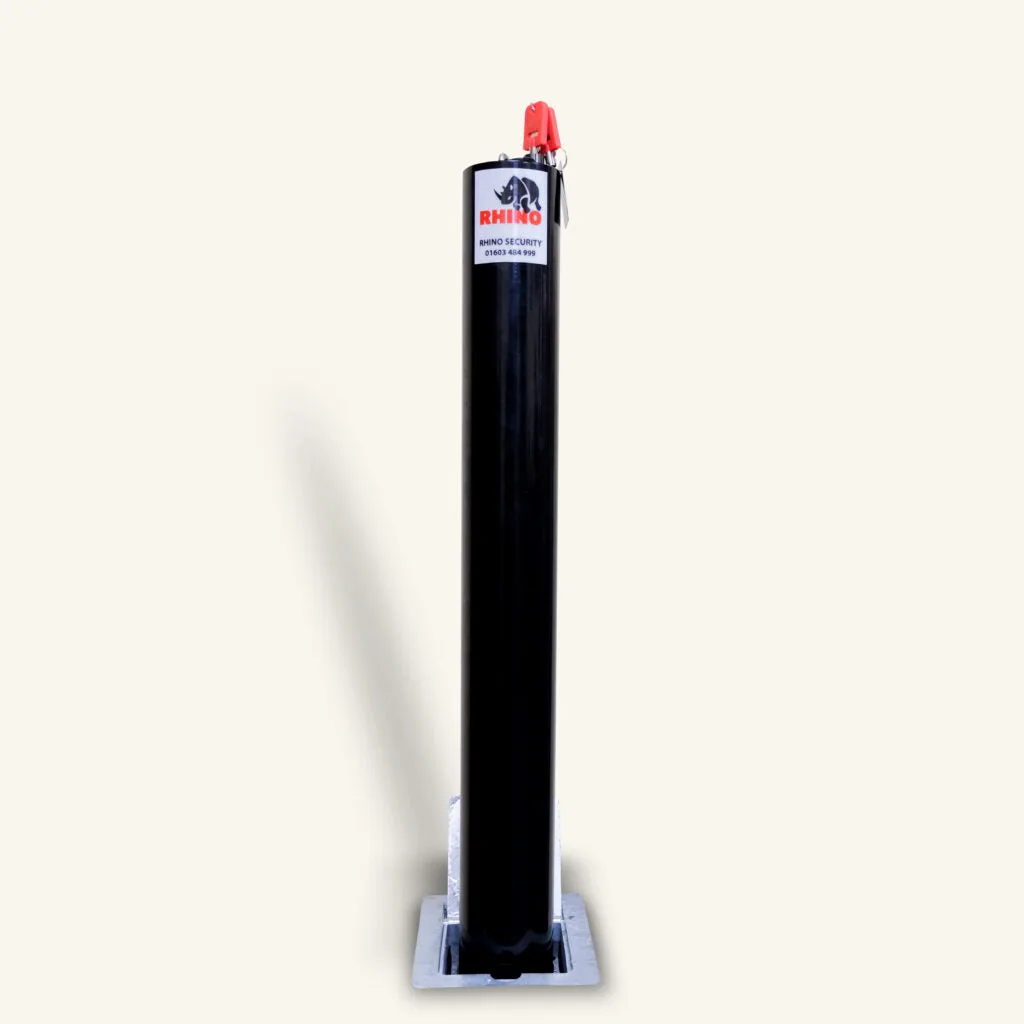
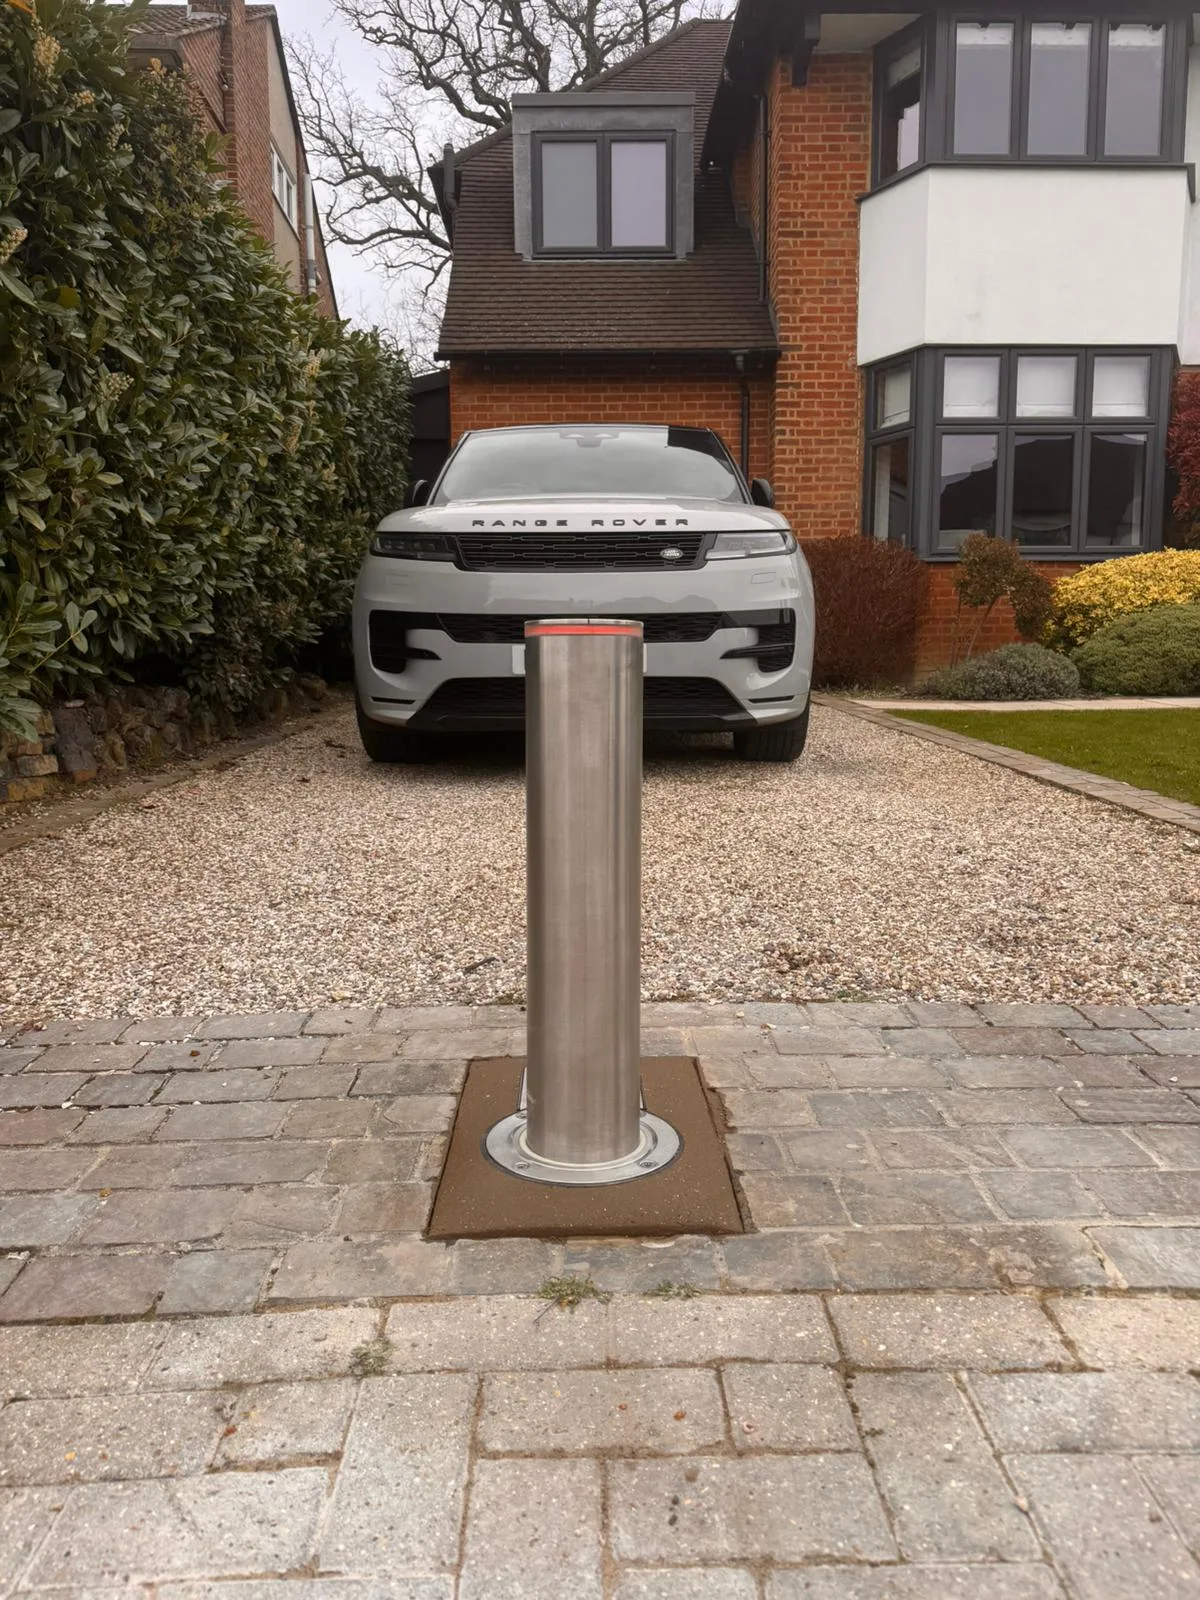
The most direct fix is a physical one. Locked driveway bollards stand in front of the car, so even if a thief gets in and starts it, they can’t drive it off the drive. Wentworth Protection supplies and fits them across London and the Home Counties.
Use this data
Journalists, councils, residents’ groups and local news sites are welcome to use these figures. Please credit “Wentworth Protection analysis of Home Office police recorded crime data” and link to this page. The underlying data is published by the Home Office under the Open Government Licence. We will update the tables when new quarterly figures come out.
Download the full dataset, with every area, the previous year, rates, ranks and thefts from vehicles: car-theft-by-area-2026.csv (CSV, 96 areas).
Method and sources
Thefts of a motor vehicle: Home Office, Police recorded crime Community Safety Partnership open data, year ending March 2021 to year ending June 2026, updated 22 October 2026. We use offence code 48, “theft or unauthorised taking of a motor vehicle”: the same measure the ONS reports as theft of a motor vehicle. Thefts from a vehicle are offence code 45.
Period: July 2025 to June 2026 (the latest 12 months published), compared with July 2024 to June 2025. Figures are by community safety partnership, which matches a London borough or council area (four Buckinghamshire partnerships cover the old districts, and Dartford and Gravesham share one).
Rates per 1,000 residents: our calculation, using the ONS mid-2024 population estimates published with the ONS police force area data tables, year ending June 2026 (Table C4), released 22 October 2026.
London cross-check: Metropolitan Police recorded crime by borough, London Datastore (updated 8 October 2026). The Met assigns almost every theft to a borough, so its borough figures run a little higher than the Home Office’s.
Things to bear in mind: these are crimes recorded by the police, not every theft that happens. Forces record and locate crimes in slightly different ways, and small numbers can swing a lot from one year to the next, so we only show a change where there were at least 50 thefts the year before (as the ONS does).
Frequently Asked Questions
Which London borough has the most car thefts?
Croydon, with 1,713 thefts of a motor vehicle between July 2025 and June 2026, just ahead of Enfield (1,697) and Newham (1,665) (Home Office data). The Met’s own figures for October 2025 to September 2026 put Enfield first, with 1,839.
Which Home Counties area has the most car thefts?
Thurrock in Essex, with 920 thefts of a motor vehicle between July 2025 and June 2026, followed by Milton Keynes (610) and Basildon (505).
Where is the car theft rate highest?
Enfield, with 5.2 thefts of a motor vehicle for every 1,000 residents in the year to June 2026. Thurrock (5.1) and Barking and Dagenham (4.5) come next.
Where is car theft rising fastest?
In Wokingham, where thefts of a motor vehicle rose 37.5%, from 128 to 176. Colchester (+33.4%) and Tendring (+33.1%) were next. Overall, car theft fell in 62 of the 92 areas.
Where is car theft lowest?
South Oxfordshire had the lowest rate, at 0.5 thefts per 1,000 residents, followed by Vale of White Horse and Waverley (0.6 each). In London, Kingston upon Thames had the lowest rate (1.8).
 How Much Does a Ghost Immobiliser Cost in the UK?
 Car Tracker vs Immobiliser vs Driveway Bollard: Which Stops Car Theft?
